Can Transformers Explain the Business Cycle?
In Using Transformers and Reinforcement Learning as Narrative Filters in Macroeconomics, toghether with Leif Anders Thorsrud ask a practical question: can one model track the business cycle and produce a coherent narrative of what is driving it? The paper can be found here:
Their answer is a multimodal Transformer, the Narrater, trained on both macro time series and news text.
The Core Idea
Most macro models are strong on measurement but weak on narrative interpretation. Most NLP systems are the opposite.
The Narrater combines both worlds:
- time-series inputs for macro dynamics
- text inputs for narrative content
- a structural decomposition into demand, supply, and noise components
The objective is not model-free causal discovery. It is a supervised structural filter: estimate cyclical conditions in real time, then attribute the most relevant narrative.
What It Delivers
On validation data, the model reports very high classification accuracy and low prediction errors. Against simpler baselines, the gains are meaningful, especially for sentiment extraction.
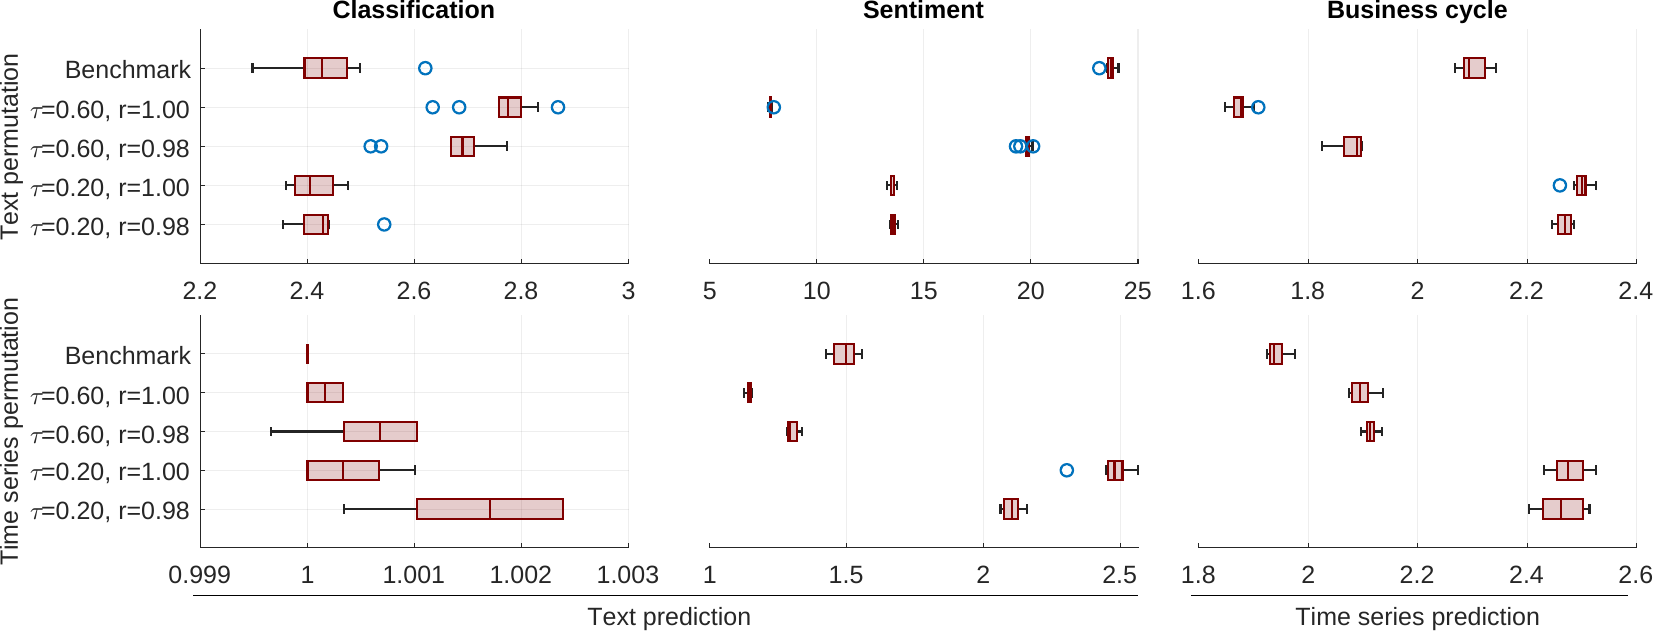
The permutation tests are useful because they show how the model learns:
- text dominates text classification
- both text and time series matter for business-cycle prediction
- sentiment is multimodal, but more text-sensitive
Real-Time Performance
In out-of-sample testing (2010 to 2023), the Narrater is broadly comparable to a DFM benchmark, with clearer relative gains during volatile periods like early Covid.
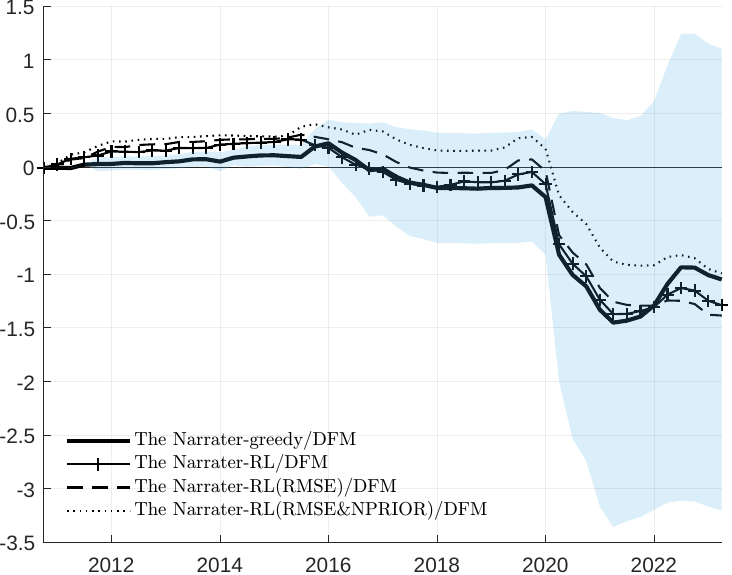
The paper also reports that within-quarter performance improves as additional news arrives, consistent with a nowcasting-style information flow.
From Forecast to Narrative
The most interesting contribution is the narrative layer.
The model selects high-probability articles and maps them into a structural decomposition. That produces an interpretable storyline of demand, supply, and noise over time.
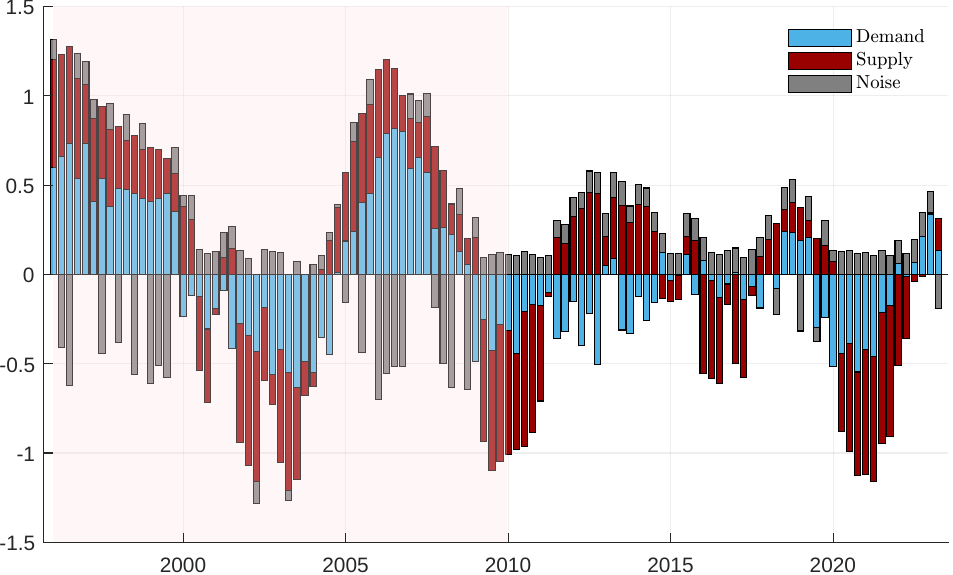
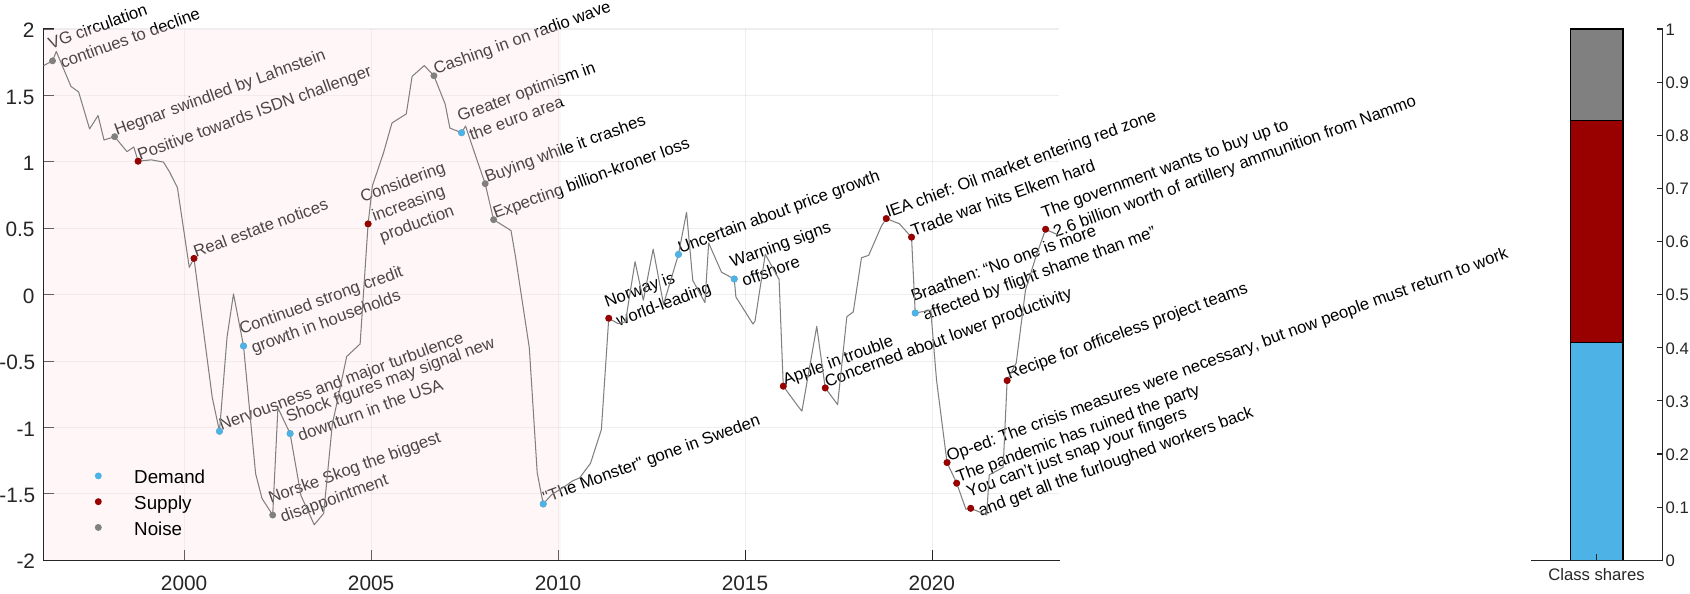
This is where the paper stands out: it does not just predict better in some periods. It also gives a systematic way to connect macro movements to concrete, high-frequency news narratives.
For policy work and real-time monitoring, that combination is the main value proposition.